Pie chart. Data table with 2 rows and 2 columns follows.
Milk Contains Milk Solids & Native Milk Water
Milk Solids as Fat & SNF
Native Water In Milk
12
88
Milk contains FAT, SNF and Native Milk Water
Milk contains FAT, SNF and Native Milk Water
Pie chart. Data table with 2 rows and 3 columns follows.
Milk contains FAT, SNF and Native Milk Water
Fat
Solid Non Fat
Native Water in Milk
4
8
88
Milk Solids Detailed
Milk Solids Detailed
Pie chart. Data table with 2 rows and 4 columns follows.
Milk Solids Detailed
Fat
Proteins
Lactose (Carbohydrates)
Vitamins & Minerals
4
3.3
3.9
0.8
Milk is Consumed for the
Fat – Sustainable Energy Providing Fuel.
Proteins – The building Block for all Living Beings.
Lactose (Carbohydrates) – A Primary Fuel for our Body.
Minerals – Calcium, Magnesium, Phosphorus in the Most Bio Available form.
Vitamins – All the Essential Vitamins in Right Portions
Humans are Mammals that have Milk as Primary Source of Protein and Fat In Initial Stages of Life. As Humans are Mammals, Having Milk as a Source of Food is the Right ways and Hence Milk is called the “Most Perfect Food”
We Humans Like to have a Ratio Between the amount of Fat and Proteins that we consume in our Regular Diet Due to Variuos reasons like Life Style, Work Nature Etc. Hence the Milk (Nature’s Most Perfect Food) was Rationalised to Get the Best of Milk in a Ratio Suitable for Each and Everyones Need for Every Stage of Life.
The Milk is Standardized to Achive preferable Ratio Between FAT & Proteins
Double Toned Milk | Raaj Lean Milk
Pie chart. Data table with 2 rows and 4 columns follows.
Double Toned Milk | Raaj Lean Milk
Fat
Proteins
Lactose
Minerals
1.5
3.5
4.6
0.9
Toned Milk | Raaj Ideal Milk
Pie chart. Data table with 2 rows and 4 columns follows.
Toned Milk | Raaj Ideal Milk
Fat
Proteins
Lactose
Minerals
3
3.5
4.2
0.8
Standardized Milk | Raaj Active Milk
Pie chart. Data table with 2 rows and 4 columns follows.
Standardized Milk | Raaj Active Milk
Fat
Proteins
Lactose
Minerals
4.5
3.5
4.2
0.8
Full Cream Milk | Raaj Cafe Milk
Pie chart. Data table with 2 rows and 4 columns follows.
Full Cream Milk | Raaj Cafe Milk
Fat
Proteins
Lactose
Minerals
6
3.5
4.6
0.9
Raaj Lean Milk
Double Toned Milk
Raaj Ideal Milk
Toned Milk
Raaj Active Milk
Standardized Milk
Raaj Cafe Milk
Full Cream Milk
The Different Types in Milk Can Also Be Explained as Below
Milk Standards and their Fat to Proteins Ratio Can Be Clearly Seen as
Fat : Proteins Ratio
Milk can be Defined as (all data are in % of Milk)

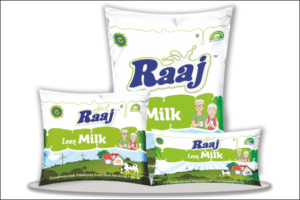 Raaj Lean Milk
 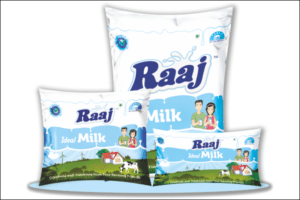 Raaj Ideal Milk
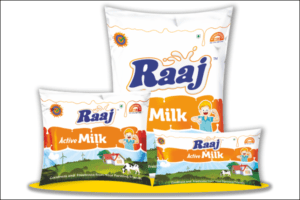 Raaj Active Milk
 Raaj Cafe Milk